A Portrait of Our Community
Learning about ourselves from the Nevada Jewish Community Study
The Nevada Jewish Community Study was commissioned by Jewish Nevada and conducted by Professor Lee Bernick at the University of Nevada, Las Vegas.
The survey, which was administered by mail, took place between August 2021 and July 2022. Rosov Consulting conducted focus groups in 2023 and handled survey and focus group data analysis.
The survey sample was developed from people with distinctive Jewish names in publicly-available Nevada voter registration files and from people on Jewish organizational lists. Respondents were included if they or someone else in their household consider themselves Jewish or were raised Jewish, or if a child in the household is being raised Jewish. The final sample had 510 respondents and a margin of error of approximately 4.3%.
The survey covered various topics, including demographics, Jewish affiliations and needs, as well as social and economic vulnerability.
To make the sample as representative of the Nevada Jewish population as possible, Rosov Consulting adjusted the data with survey weights based on benchmarks from the American Jewish Population Project at Brandeis University, local synagogue memberships, and Federation donors. All data provided on this site are weighted.
Respondents qualified for the study if they or someone else in the household
considers themselves Jewish or were
raised
Jewish

Consider self Jewish

Raised Jewish but do not consider self Jewish now

Another adult in household considers self Jewish or was raised Jewish, or a child in household is being raised Jewish
The median age of those who took the survey is 51, and almost one-third are 65 or older.
Most households (60%) are made of couples and single adults without children.
Most respondents live in the metro Las Vegas area, with about half in Las Vegas itself (Summerlin and other areas in the Rest of Las Vegas), and more than a quarter in Henderson. Fifteen percent of respondents are from Reno/Washoe County.

The vast majority of respondents were born elsewhere and moved to Nevada over time. Only 5% of all respondents were born in Nevada. The three most common states where respondents were born are New York, California, and New Jersey. Thirteen percent (13%) were born outside the United States, with about half of them coming from Israel.
There are a lot of recent movers to the state, with twice as many residents having been in Nevada for 10 years or less than residents who have been here more than 30 years. The median number of years in Nevada is 16.
Respondents are well educated, with almost 70% having a college degree (almost three times the percentage of all people in the Las Vegas-Henderson area). The median household income is $94,000 (about $25,000 higher than the median household income for all households in the Las Vegas-Henderson area). Sixty percent of respondents are employed and more than a quarter are retired, consistent with the share of respondents who are age 65+.
Highest Education Attained
Median Household Income:
$94,000

More than 70% of respondents are married or partnered, and among them, more than half are in an interfaith marriage or partnership. Among those who are married/partnered, the proportion who are intermarried/partnered changes very little across different age groups.
Sixteen percent (16%) of respondents live in a household where someone identifies as LGBTQ+. That rises to 39% among Henderson residents and drops to just 4% among residents in Las Vegas outside Summerlin. More younger than older respondents identify as LGBTQ+, pointing towards increasing diversity in the Jewish community.
Eleven percent (11%) of respondents identify as a Person of Color, and 22% live in a household where someone — either themselves or another person — is a Person of Color. This percentage is much higher for respondents under 50, again revealing the increasing diversity of the Jewish community.

Respondent is
Person of Color

Someone in household is
Person of Color
Jewish Backgrounds
Most of the people surveyed were raised Jewish, but only about half of them went to Hebrew school and had their Bar or Bat Mitzvah, and fewer than half went to Jewish summer camp.
Personal Engagement
The most common religious practices among respondents are lighting Hanukkah candles and hosting or attending a Passover Seder.
Overall, Reform and Just Jewish/Secular are the most common denominational identities. Mirroring trends among American Jews nationally, the youngest age group (21-34) in Nevada is both the most likely to be Orthodox and the most likely to be Just Jewish/Secular, suggesting a growing polarization in the community along denominational lines.
Respondents in households where someone is a Person of Color are usually more personally engaged with Jewish life than other respondents.
On the other hand, respondents in interfaith marriages/partnerships are less inclined to be personally engaged with Jewish life.
Communal engagement
Fifteen percent (15%) of respondents are currently synagogue members. Among the others, the most common reasons cited for not being a member are that they are not religious and the costs are too high.
In other forms of communal engagements, 43% of respondents donated to a Jewish nonprofit and 21% volunteered for a Jewish nonprofit in the year before taking the survey.
43%
Donated to Jewish nonprofit organization in past year
21%
Volunteered for Jewish nonprofit organization in past year
Several groups are less likely to be communally engaged, including respondents in households that are economically vulnerable (i.e., those with income below 250% of the federal poverty line), where someone identifies as LGBTQ+, and that have interfaith couples. Respondents in households where someone is a Person of Color are sometimes more and sometime less communally engaged than other respondents.
Feeling Welcomed
Two-thirds of respondents said they feel welcomed attending a Jewish event in Nevada. However, some people are less likely to feel this sense of being welcomed, including respondents who are economically vulnerable, have someone in their household who identifies as LGBTQ+, live in Las Vegas outside Summerlin, identify as Reform, are in interfaith marriages or partnerships, and are under 50 years of age.

Feel welcomed attending Jewish sponsored programs in Nevada
Raising Children Jewish
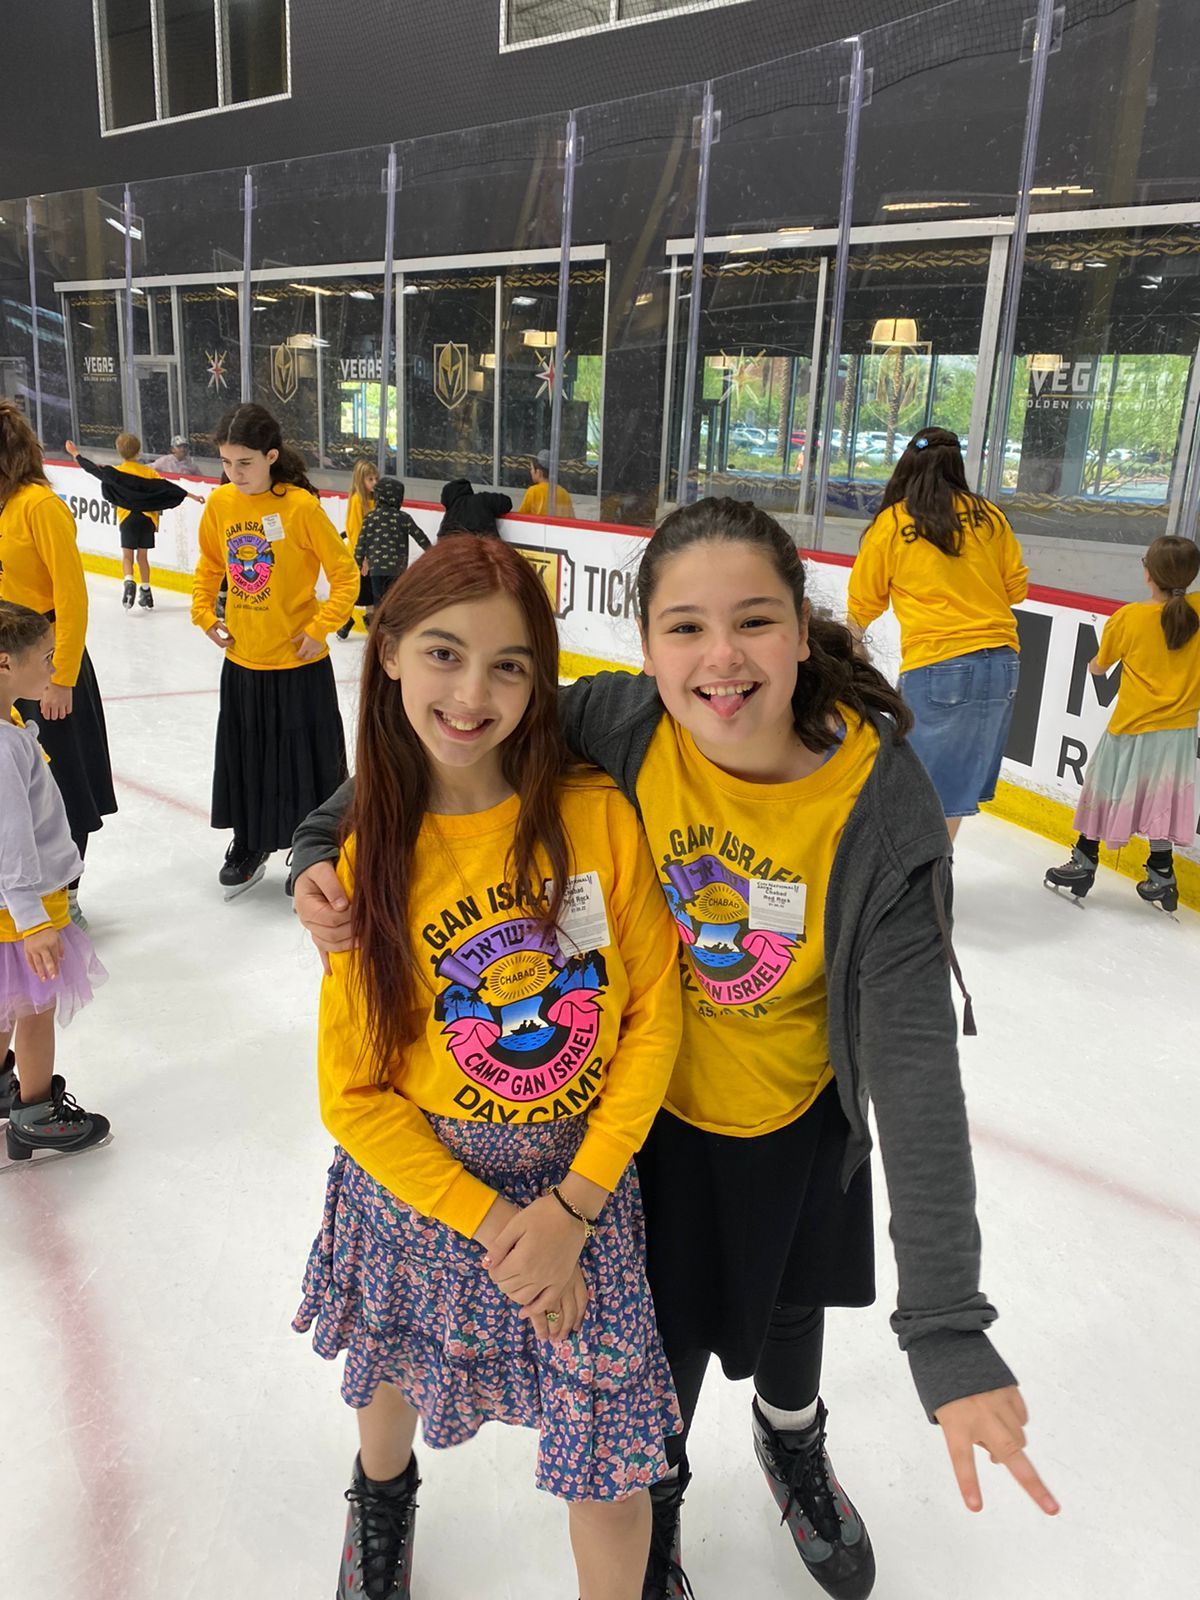
Three quarters of respondents with children in their household say they are raising their children Jewish. About a third have enrolled a child or children in Jewish preschool, day camp, or day school, and about a sixth in Jewish overnight camp.
Altogether, among respondents who have children ages 6 to 17, 46% have enrolled a child in either a Jewish day school, Jewish overnight camp, or Jewish day camp.
40%
of all respondents have a child in their household
Community Needs
When asked about community needs, roughly two-thirds of respondents expressed a desire for a JCC building, a Jewish home for the elderly, more programs for school-age children, and cultural activities at lower or no cost. In contrast, only about half said there is a need for more adult Jewish education or programs tailored for singles.
The youngest Jews (18-34) are the most likely to say that the Nevada Jewish community needs a JCC, Jewish home for the elderly, more programs for school age children, no or low-cost cultural activities, and more adult education.
Respondents in households with People of Color are more likely than respondents in other households to say the Jewish community needs each of the facilities and programs the survey asked about except more adult education.
Similarly, respondents in LGBTQ+ households are more inclined to say the Jewish community needs each of the facilities and programs the survey asked about except more programs for singles.
Conversely, intermarried/partnered respondents are less likely than in-married/partnered respondents to say the Jewish community needs a JCC, Jewish home for the elderly, more programs for school-age children, no or low cost cultural activities, and more programs, but the differences are relatively small.
Percentage of respondents who feel the community needs a...
A focus group on the JCC revealed a desire for a brick-and-mortar JCC building, and identified ideal components of it, including flexible use spaces, office spaces, child and elder-care facilities, and recreational and sports facilities.
The ideal JCC would have:
Flexible use spaces
Child and elder-care facilities
Office space
Recreational/sports facilities
Israel and Antisemitism
All data in this study were collected before the October 7, 2023 attack on Israel.
Though we can't know for sure, it is likely that some of the data, especially attitudes about Israel and antisemitism, would be different if collected now. Several national surveys since October 7, 2023 show U.S. Jews in general feel more connected to and concerned about Israel, as well as more aware of and worried about antisemitism. See, for example,
a
March 2024 survey from the Jewish Federations of North America
and Pew Research Center reports from
March and
April 2024.
At the time of the survey, more than half of the respondents had visited Israel, many on Birthright trips. Additionally, three quarters of the respondents felt strongly that Israel needs to exist as a Jewish state, and three quarters said they were deeply concerned about the Israeli-Palestinian conflict.
However, only half said they see an important role for the US in resolving the conflict.
More than a quarter (28%) of respondents said they had experienced antisemitism in the year before the survey, and almost three quarters (73%) said antisemitism was worse at the time of the survey than five years before.

Experienced antisemitism in past year

Believe antisemitism worse now than five years ago
A significant minority of respondents are currently or recently economically vulnerable.
Almost a quarter of respondents have household income below 250% of the federal poverty line. To put this in perspective, in 2022 when this survey was conducted, 250% of the federal poverty line was equal to about $35,000 for a single person household, $46,000 for a two-person household, $58,000 for a three-person household, and $70,000 for a four-person household.
Additionally, in assessing their own financial situation, more than a third (35%) report struggling to make ends meet, or having been unable to do so, at some point during the past three years. And one-fifth of respondents (21%) indicate that within the past three years, they have faced instances where they did not have enough money to pay for medical care, rent/mortgage, a utility bill, or food.

of households have income below 250% of the federal poverty line
Financial Self-Assessment
In the past 3 years, have there been times when you or anyone in your household did not have enough money to:
21%
have not had enough money for one or more item
With economic vulnerability comes social vulnerability. Compared to others, respondents in households with income less than 250% of the federal poverty line have more unmet needs around activities of daily living and caregiving, know fewer people to help them in an emergency, are more likely to be on Medicaid or to have no health insurance, and are far less confident about having sufficient money for retirement.
Respondents who are younger or live in households where someone identifies as a Person of Color or LGBTQ+ tend to be worse off than others when it comes to income and their own financial self-assessments, as well as some indicators of social vulnerability.
Moving forward, Jewish Nevada will use these survey findings to help develop priorities and recommendations for action for the Nevada Jewish community.
Do you want to provide feedback about the survey?
Are you interested in learning more about our work ahead?
Would you like to help shape our community's future?
Contact us and tell us
how you want to be involved!


